Personal Project - I undertook this project during the start of the penultimate year summer break to hone my knowledge in statistics and analytical thinking.
Key Results:
- Identified features with statistical hypothesis test such as ANOVA, Chi-Sqaured Test and Bonferroni Method with R.
- Achieved 75% prediction accuracy on Kaggle Competition with Gradient Boosting Classifier algorithm in Python.
Table of Contents
-
- About the Project
-
- Personal Motivation for this project
-
- Findings
- 3.1 Exploratory Analysis
- 3.2 Correlation Matrix
- 3.3 Regression and Machine Learning Models
-
- Link to Jupyter Notebook
-
- Source Code
1. About the Project
The goal of this project is to utilised the dataset provided from Kaggle website to analyse the possible factors that affecting survivability and creating a prediction model for survivability of passengers using variables from the dataset for the Kaggle Titanic Competition
2. Personal Motivation for this project
In addition, my personal goal for this project is to use this project as an application for my university module on Statistics, to make use of the statistical tools to create inference, analysis through hypothesis testing and finally creating regression models. The Statistical methods I applied are: ANOVA, Chi-Squared Test, Bonferroni Method, Regression Modelling(Logistics & Linear Regression), Ordinal & Nominal Encoding, and Correlation Coefficient.
3. Findings
3.1 Exploratory Analysis
For the analysis component of the project: Through the statistical test conducted, I’ve found that the factors that had the biggest impact on the survivability of passengers are the Fare, Sex, Ticket Class, Port of Embarkation and Size of family. While the age, Social Status and Ticket Number had little statistical significance with the survivability of passengers.

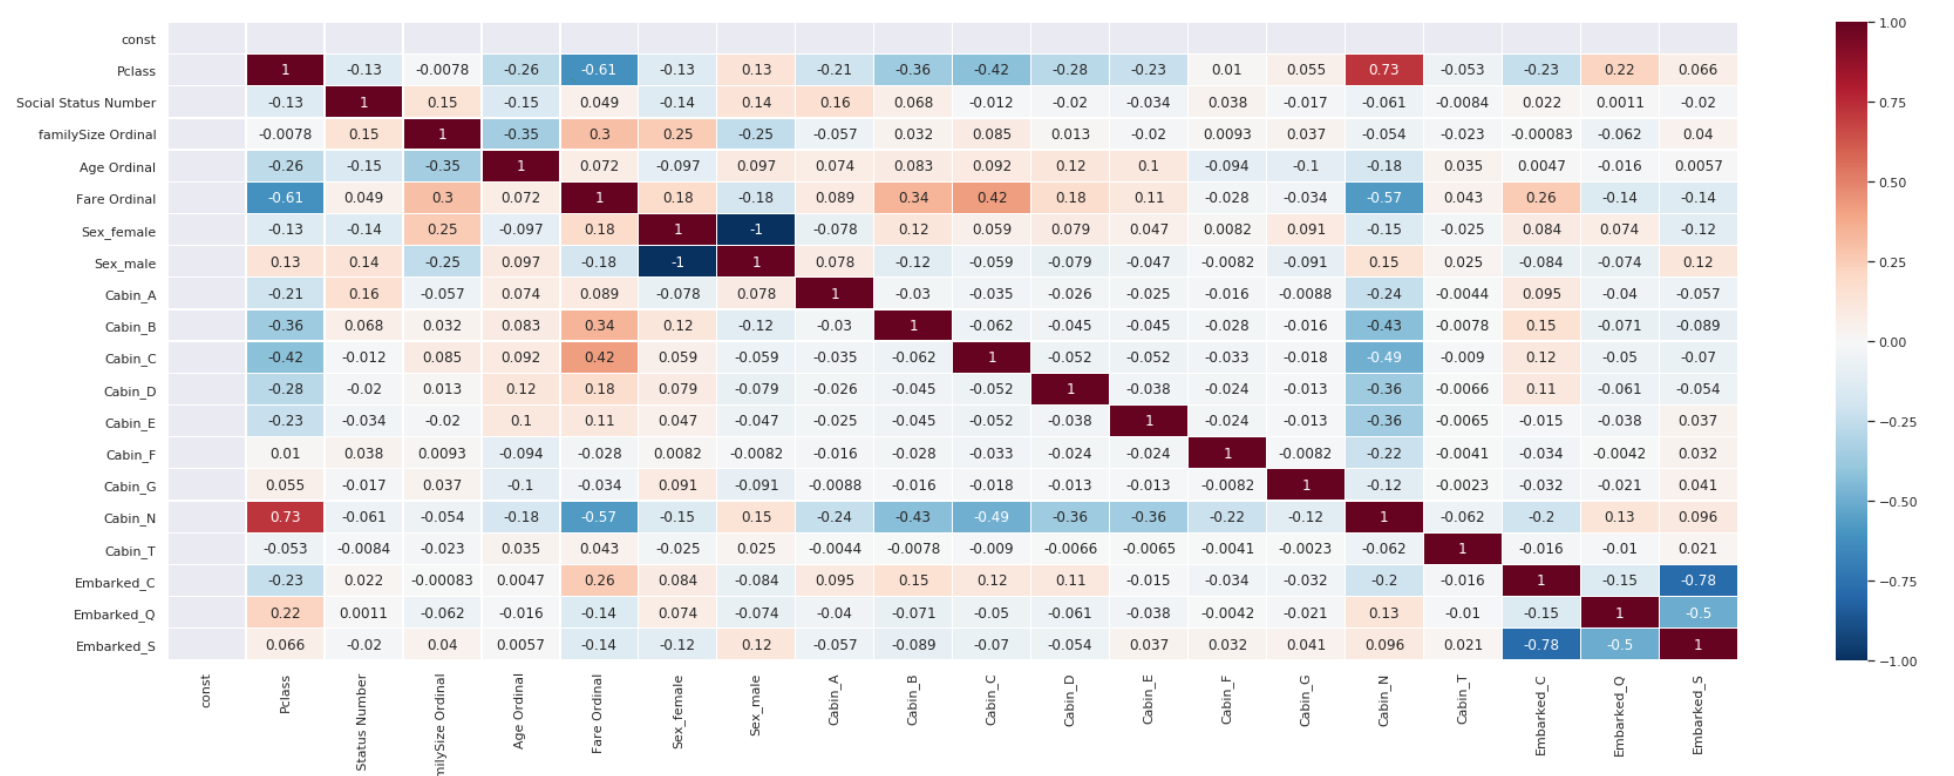
3.2 Correlation Matrix
The correlation matrix gives an overview the coefficient of determination for the different factors, which will be subsequently used in point 3.3 Regression and Machine Learning Models.
3.3 Regression and Machine Learning Models
For the forecasting component of the project: We tested various regression and machine learning algorithms, and evaluated their performance based off the mathematical score and validation algorithm. Through this evaluation, I determined that the Logistics Algorithm delivered the a high score within a reasonable computation time and would be my preferred algorithm to predict the survivability of passengers.
4. Link to Jupyter Notebook
The project is best viewed in a notebook viewer, which can be accessed here. In this notebook, you will see the exploratory analysis, forecasting modelling and my personal inputs along the way.
5. Source Code
The source code can be found at my Github link.